Differences in impact #
Around 700 million people still live in poverty, mostly in low-income countries. Efforts to help them - by policy reform, cash transfers, or provision of health services - can be incredibly effective.
Alongside investigating this issue, we also discuss how much more effective some interventions are than others, and we introduce a simple tool for estimating important figures.
Key concepts from this session include:
- Differences in impact: It appears that some of our options to help do many times more good than others. People generally don’t appreciate this, and so miss out on significant opportunities to help.
- The importance, neglectedness, tractability framework: The most important problems generally affect a lot of people ( importance or scale ), are relatively under-invested in ( neglectedness ), and can be meaningfully improved with a reasonable amount of work ( tractability ).
- Thinking on the margin: If you’re donating $1, you should give that extra $1 to the intervention that can most cost-effectively improve the world. There are many great initiatives with a very high average impact per dollar that will have a low marginal impact because they can’t get the same efficiency at scale (they display “diminishing marginal returns”).
- Fermi estimates: When you’re trying to make a decision, it can be useful to make a rough calculation for which option is best. Even if there’s a lot of uncertainty, this can give you a rough answer, and can tell you which things are most important to estimate next.
This work is licensed under a Creative Commons Attribution 4.0 International License .
A framework for comparing global problems in terms of expected impact #
This is a linkpost for https://80000hours.org/articles/problem-framework/
Suppose you’re trying to figure out whether to learn about health in developing countries; or whether to become a researcher in solar energy; or whether to campaign for criminal justice reform in the USA. Which of these areas is most effective to focus on?
A year’s work on some problems can help a lot more people than a year’s worth of work on other problems. In fact, our analysis suggests that which problem areas you choose to work on may be the single biggest determinant of the social impact you have with your career.
We often make use of an informal framework for comparing problems in terms of their potential for an additional person to have a positive impact: scale , neglectedness , solvability and personal fit. Here’s a popular introduction to the framework .
Applying the informal version of the framework is useful, and good enough for many situations, but it can lead to some issues like double counting. In this article, we outline a more precise, quantitative version of the framework, and give more details on how to apply it to make your own comparisons of areas.
The framework was first created by Open Philanthropy . We further developed this process in collaboration with staff at the Future of Humanity Institute , a research group at the University of Oxford that advises policy-makers and major decision-makers on how to prioritise global problems (learn more about global priorities research ).
This framework is just one tool we use to compare different global problems, and has a number of weaknesses. We discuss some of the pros and cons of this approach compared to qualitative approaches and cost-effectiveness analysis at the end of the article. Here’s a more comprehensive process you can use to compare global issues . If you’re coordinating with a community there are also some further factors to consider .
If you just want to see the framework in action, here’s a list of scores from 2017 .
This article was mostly written in 2017. We added some quick updates in October 2019 to further flesh out and update some of the main points, though it doesn’t cover all our thinking on this issue.
Introducing how we define the factors #
Ultimately what we want to know is the expected ‘good done’ per unit of resources invested in the problem. A unit of resources could be a year of labour or a dollar of donations, or some other measure.
This is hard to estimate by itself, so we need to break it down into components that we can estimate individually.
In our introductory article , we gave a rough breakdown into some qualitative factors. Here is more precise, quantified version of the same break down:
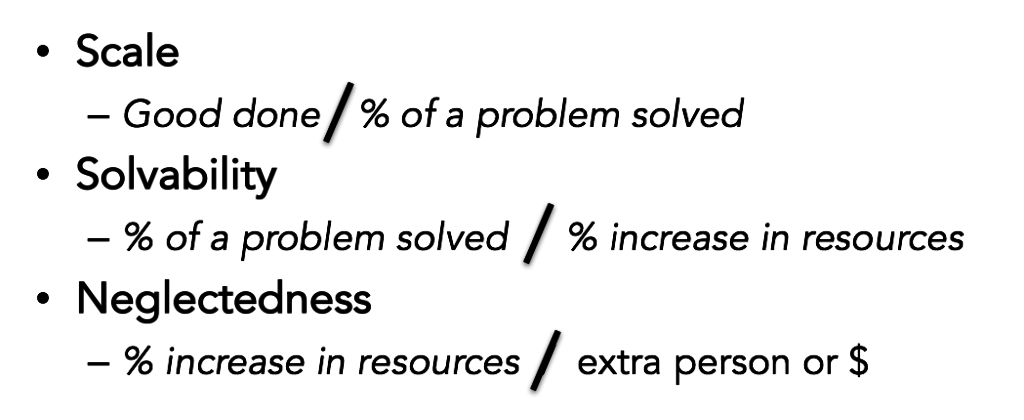
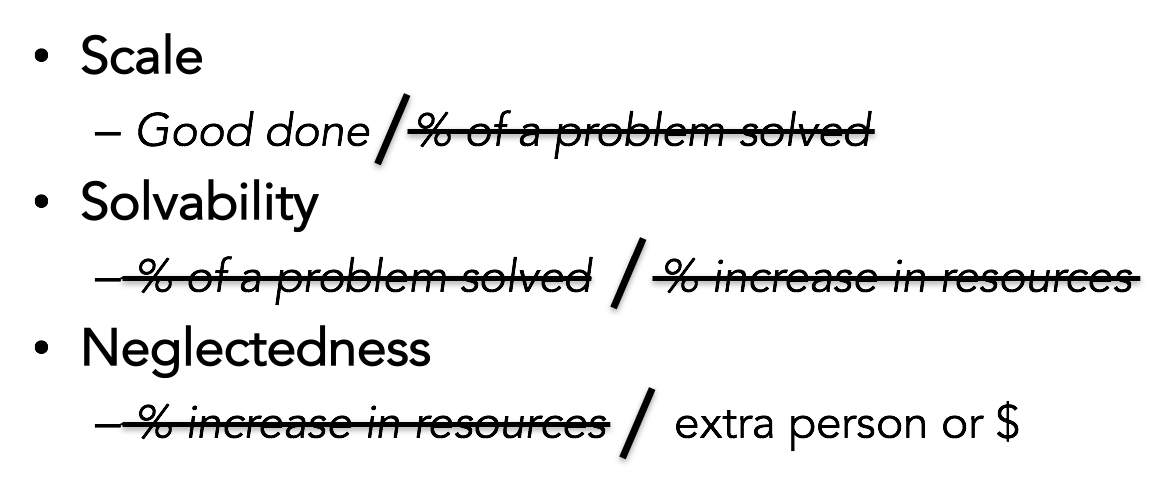
A good reason to do it this way, is that if we multiply these three terms together, we will get back to ‘good done’ / ‘extra person or $’ allocated to the problem:
So, now we’ve broken “good done per $” into three components that each have a quantitative definition. What are these components, in plain English?
- Scale – if we solved the problem, how good would it be?
- Solvability – if we doubled the resources dedicated to solving this problem, what fraction of the problem would we expect to solve?
- Neglectedness – how many resources are already going towards solving this problem?
Finally, if you’re trying to figure out what problem you should work on, you can add bonus points for problems that you are better suited to working on, which we explain in more depth later.
Below we’ll discuss how to assess each in turn, but before that we have a few more remarks on how to set up the analysis.
Defining a problem carefully #
Before you go on to make your assessment, make sure you have a clear description of the scope of the problems you want to compare. This will help you to be consistent when scoring each factor. For example, if we were evaluating ‘global health’ we would need to be clear about:
- Which diseases are included (e.g. TB, HIV, Malaria, etc)
- Which countries we are considering (i.e. only the poorest countries, or also middle income countries?)
A challenge of any framework of this kind will be that carefully chosen ‘narrow’ problems tend to do better than broadly defined ones. For example, ‘combating malaria’ will look more pressing than ‘global health’ because malaria is a particularly promising health problem to work on. Similarly, improving health in Kenya is going to look more impressive than improving health in Costa Rica. There’s nothing wrong with these findings – but they could create a misleading impression if a broadly defined problem is compared with a narrowly defined one. If someone were motivated they could make a problem look more or less pressing by defining it differently – and this is something to be aware of in interpreting these scores.
Creating a (logarithmic) scale #
If you try to compare different areas using these scores you’ll find they vary hugely. For instance, while about $300bn is spent on global health annually , under $100m is spent trying to tackle factory farming . So, factory farming is over 1,000 times more neglected than global health.
This means it’s more convenient to use a “logarithmic scale” to rate each component. The way we do this is every two points we add to a problem means that it’s 10x more effective. For instance, if we give one problem a neglectedness score of 4 and another of 6, then we mean the second one is 10 times more neglected.
This is like the Richter scale used to measure earthquakes. An earthquake that that’s Richter 8 is actually 10-times more powerful than one that’s Richter 7.
Using a logarithmic scale for each part also means that rather than having to multiply Scale , Solvability and Neglectedness in order to get our overall cost-effectiveness estimate, we can simply add them together. (As the quantitatively inclined among you might recall from high school, this is because log(AB) = log(A) + log(B).)
To make the scores easy to read we put them all on a scale between 0 and 16. For comparisons of cost-effectiveness between different problems, we will just be looking at the difference in score between them.
How to assess scale #
Definition #
If we solved this problem, by how much would the world become a better place?
For example, cancer is a bigger problem than malaria because it is responsible for 8% of all ill-health worldwide (measured in QALYs lost), whereas malaria is responsible for 2.7% of ill-health worldwide. 1 If we got rid of all cancer it would reduce ill-health significantly more than if we got rid of all malaria.
One way to measure the scale of a problem in terms of its effect on wellbeing, because this is something most people care about, and we have tools to allow comparison between different kinds of benefits. (Though we don’t claim wellbeing is all that matters – read more about the definition .)
This means scale can be increased by either (i) affecting a larger number of people (ii) affecting the same number of people in a bigger way, including both short-term and long-term effects. We use a broad notion of wellbeing, so the effect could improve many aspects of someone’s life, including: happiness, health, a sense of meaning, positive relationships, and so on.
In practice, we take a longtermist perspective , so for us, assessing scale comes down to working out which issues have the greatest significance for future generations.
If you have different values from us, you can use the framework with a different definition of scale.
It can also be useful to group instrumental sources of value within scale, such as gaining information about which issues are most important, or building a movement around a set of issues. Ideally, one would also capture the spillover benefits of progress on this problem on other problems. Coordination considerations, as briefly covered later, can also change how to assess scale.
Note that we also defined scale as the good done by solving the whole problem; however, you could also do the analysis with solving 10% of the problem, so long as you do that consistently with the other factors as well.
How to assess it #
Sometimes it’s possible to make fairly precisely quantified comparisons of scale, like in the case of cancer vs. malaria above.
However, often this is not the case. This is particularly true when you try to factor in the long-run and indirect effects of solving a problem. Suppose you make a breakthrough in physics – how many people are ultimately going to be affected? It’s hard to say, but we shouldn’t conclude from this that physics breakthroughs don’t matter.
To make more wide ranging comparisons between problems, you need to turn to “yardsticks” for scale. These are more measurable ways of comparing scale that we hope will correlate with long-run social impact.
For instance, economists often use GDP growth as a convenient yardstick for economic progress (although it has many weaknesses). Nick Bostrom has argued that the key yardstick for long run welfare should be whether an action increases or decreases the risk of the end of civilization – what he called existential risk .
Here is one set of yardsticks (on the top row), which we assess with the following rubric:
| If we solved this problem it would be equivalent to: | A reduction in the risk of extinction (or increase in the expected value of the future) of: | Raising global economic output proportionally by this amount per year: | Increase in income among the world’s poorest 2 billion people: | Saving this many years of healthy life each year: | Illustrative Example |
|---|---|---|---|---|---|
| 16 | 10% | Eliminate the risk of both nuclear war and pandemics | |||
| 14 | 1% | $100 trillion | $3 trillion | 1 billion QALYs | Eliminate extreme poverty |
| 12 | 0.1% | $10 trillion | $300 billion | 100 million QALYs | Cure cancer |
| 10 | 0.01% | $1 trillion | $30 billion | 10 million QALYs | Increase aid by a third and spent it on cash transfers |
| 8 | 0.001% | $100 billion | $3 billion | 1 million QALYs | Eliminate land use restrictions in major US cities |
| 6 | 0.0001% | $10 billion | $300 million | 100,000 QALYs | Remove 5 min/day needless red tape for US teachers |
| 4 | 0.00001% | $1 billion | $30 million | 10,000 QALYs | Identify all risky asteroids |
| 2 | 0.000001% | $100 million | $3 million | 1,000 QALYs | Turn 10,000 people vegan |
| 0 | 0.0000001% | $10 million | 300000 | 100 QALYs | Save 3 lives |
This process is most robust when you’re comparing problems that use the same yardstick e.g. comparing several problems in terms of how much they improve health. The tradeoffs _ across_ the columns are extremely uncertain , and an active topic of research by groups like the Future of Humanity Institute.
The trade offs across columns are also very sensitive to big worldview and value judgements. People disagree over what most matters to wellbeing, how to value people in the future, and how to value non-humans. For example, some people believe that general economic growth is not good at all, because of unintended side effects (e.g. climate change, or the more rapid invention of dangerous new technologies). ( This tool leads you through some of the most important judgement calls.)
The rubric above reflects our own considered judgement calls at how to trade different yardsticks against each other. We don’t fully explain our reasoning, which is hard to make explicit. Read more about how to choose a yardstick and also see Crucial Considerations and Wise Philanthropy by Nick Bostrom. (Unfortunately, this article and our choice of yardsticks are not fully up-to-date with our latest thinking, though the broad ideas and direction are still correct.)
If a problem helps with several columns, then focus on the column where the problem has the largest effect. Since each row corresponds to a factor of ten, the top rows will dominate the overall assessment of scale.
How to assess how neglected a problem is #
Definition #
How many people, or dollars, are currently being dedicated to solving the problem?
Why is it important? #
After a large amount of resources have been dedicated to a problem, you’ll hit diminishing returns. This is because people take the best opportunities for impact first, so as more and more resources get invested, it becomes harder and harder to make a difference. It’s therefore often better to focus on problems that have been neglected by others.
For instance, mass immunisation of children is an extremely effective intervention to improve global health, but it is already being vigorously pursued by governments and several major foundations, including the Gates Foundation. This makes it less likely to be a top opportunity for future donors.
It’s also valuable to explore new problems because this can help us figure out which problems are in fact most pressing. That is to say, there is an additional ‘value of information’ from trying new things. If no-one has worked on a problem before, then it could easily turn out to be more solvable than is currently thought.
There are some mechanisms by which problem areas can see increasing returns rather than diminishing returns. However, we think there are good theoretical and empirical arguments that diminishing returns are the norm, and that returns most likely diminish logarithmically. Increasing returns might hold at very small scales within problem areas, though we’re not even sure about that due to the value of information benefits mentioned above. (Increasing returns seem more likely to be common within organisations rather than problem areas.)
Also note that neglectedness is only a good proxy if the area is being neglected for bad reasons by other actors. However, we think that society’s mechanisms for doing good are far from efficient, so all else equal, neglectedness is a good sign.
One particularly important way that a problem can end up neglected for bad reasons is if other people simply don’t value it. This article argues that if you care about something X times more than the average person, you should expect to be able to have X times as much impact by working on that area (by your lights). For instance, we think that the interests of future generations are dramatically undervalued by society, so by working on issues that aid future generations, we can have far more impact.
How to assess it #
| Crowdedness Score | What is the direct annual spending on the problem? | What is the number of full time staff working on the problem? | What is the number of active supporters of work on the problem? |
|---|---|---|---|
| 12 | $100,000 or less | 1 or less | 1,000 or less |
| 10 | $1 million | 10 | 10000 |
| 8 | $10 million | 100 | 100000 |
| 6 | $100 million | 1000 | 1 million |
| 4 | $1 billion | 10000 | 10 million |
| 2 | $10 billion | 100000 | 100 million |
| 0 | $100 billion | 1 million | 1 billion (i.e. everyone) |
A challenge – direct vs. indirect & future effort #
Often resources are unintentionally dedicated to solving a problem by groups that may be self-interested, or working on an adjacent problem. We refer to this as ‘indirect effort’, in contrast with the ‘direct effort’ of groups consciously focused on the problem. These indirect efforts can be substantial. For example, not much money is spent on research to prevent the causes of ageing directly, but many parts of biomedical research are contributing by answering related questions or developing better methods. While this work may not be well targeted on reducing ageing specifically, much more is spent on biomedical research in general than anti-ageing research specifically. Most of the progress on preventing ageing is probably due to these indirect efforts.
Indirect efforts are hard to measure, and even harder to adjust for how useful they are for solving the problem at hand.
For this reason we usually score only ‘direct effort’ on a problem. Won’t this be a problem, because we will be undercounting the total effort? No, because we will adjust for this in the next factor: Solvability. Problems where most of the effective effort is occurring indirectly will not be solved as quickly by a large increase in ‘direct effort’.
One could also use a directed-weighted measure of effort. So long as it was applied consistently in evaluating both Neglectedness and Solvability , it should lead to roughly the same answer.
Another challenge is how to take account of the fact that some problems might receive much more future effort than others. We don’t have a general way to solve this, except (i) it’s reason not to give extremely low neglectedness scores to any area (ii) one can try to consider the future direction of resources rather than only resources today.
More tips on how to assess #
Rather than trying to assess neglectedness directly, you can also consider rules of thumb like the following. These help you to work out how neglected it is and whether it’s being neglected for bad reasons.
- Is there any reason to expect this problem not to be solved by: (i) markets (ii) government (iii) other individuals looking to have a social impact?
- Within research, is this a new field, or at the intersection of two disciplines? These areas are most likely to get neglected by academia. ( Read more about choosing a research topic .)
- If you don’t work on the problem, how likely is it someone else will step in instead?
- If you work on this problem, will you learn more about how pressing it is compared to other problems?
Thinking through these questions can increase your confidence you haven’t missed anything in your estimate.
Note that it’s important to assess scale and neglectedness as a pair. Ultimately we care about the ratio of the two, so you need to make sure you’re assessing the same problem in both cases. If you use a different definition of the problem in each case, it will throw off your results.
If several different kinds of input are being dedicated to a problem, use the column with the lowest score. That will be where most of the total resources are: e.g. if $10bn per year is invested in a problem and 1,000 full-time people work on it, then the money dominates, so the score is 4, not 8.
Finally, we are reluctant to give very high scores for neglectedness. Even obscure problems usually attract the attention of some group in the world, and we may simply not know about them. So unless we’ve done a comprehensive search to show otherwise, we will assume that at least $1 million is being directed towards a problem.
How to assess how solvable a problem is #
Definition #
If we doubled direct effort on this problem, what fraction of the remaining problem would we expect to solve?
Why is it important? #
Even if a problem is hugely important and highly neglected, that doesn’t mean it’s an important cause to focus on. There might simply be very little we can do about it.
For example, ageing is a problem that is huge in scale: almost two thirds of global ill health is a result of ageing in some way. It’s also highly neglected: there are only a tiny number of research institutes focused on trying to prevent the causes of physical ageing (rather than to treat its symptoms, like cancer, stroke, Alzheimer’s, and so on). However, one reason it’s neglected is because many scientists believe it to be very hard to solve, which is a major reason against working on the problem right now (though its other advantages could be enough to offset this downside).
How to assess it #
We use this rubric:
| Solvability score | The doubling of the direct effort described in ‘Neglectedness’ would be expected to solve this much of the problem (defined in Scale): |
|---|---|
| 8 | 100% |
| 6 | 10% |
| 4 | 1% |
| 2 | 0.1% |
| 0 | 0.01% |
Some rules of thumb we consider include:
- Are there cost-effective interventions for making progress on this problem with rigorous evidence behind them? (ideally high up the hierarchy of evidence ).
- Are there promising but unproven interventions that can be cheaply tested?
- Are there theoretical arguments that progress should be possible, such as a good track record in a related area? (e.g. we can’t prove that medical research will be effective ahead of time, but the area has a strong track record, and rough estimates suggest it’s very effective).
- Are there interventions that could make a huge contribution to solving the problem, even if unlikely to work?
In general, we’re looking to find the best interventions to make progress on the problem, then evaluate them based on (i) potential upside (ii) likelihood of upside. We consider all forms of evidence, from rigorous trial data and speculative arguments. We take a Bayesian approach to evaluating both factors – our prior is that the intervention isn’t very effective, then we update away from that depending on the strength of the evidence (see an example ). Read more about making these kinds of estimates .
Challenges in assessment #
This is typically the hardest of the three factors to score because it requires anticipating the future, rather than simply measuring things that currently exist.
In some cases, you can estimate solvability based on the cost-effectiveness of existing techniques in a field. For example, we have a sense of how many lives would be saved by increasing spending on global health interventions based on past experience tackling HIV, malaria, tuberculosis and so on.
In other cases – where solving a problem requires innovative techniques – the scores are usually assigned based on judgement calls, ideally based on a survey of expert opinion.
Some approaches to solving problems are incremental (e.g. distributing bednets to reduce exposure to malaria-carrying mosquitoes); others offer some chance of solving a lot of the problem all at once (e.g. inventing a new malaria vaccine). For scoring we use the ‘expected value’ approach. That is, a 10% chance of solving all of a problem is scored the same as a project that would definitely reduce it by 10%. (While ‘risk aversion’ about different outcomes means that these aren’t necessarily equally valuable, it’s a good approximation.)
As discussed above in Neglectedness , problems for which most of the work is being performed indirectly (e.g. by for-profits doing related things) will likely be solved more slowly through an increase in ‘direct’ work. This is because many promising approaches will already have been attempted by other groups.
What do the summed scores mean? #
To do a sanity-check we can add these scores and convert them back into a measure of actual impact from one additional person working on a problem:
| If the problem has this score: | One extra person working on a problem… | One extra person working on a problem… |
|---|---|---|
| 28 | Saves 1 million QALYs per year | Reduces existential risk by 0.001% |
| 24 | Saves 10,000 QALYs per year | Reduces existential risk by 0.00001% |
| 20 | Saves 100 QALYs per year (2 lives) | Reduces existential risk by 0.0000001% |
However, these figures are extremely approximate, so we don’t recommend putting weight on them specifically. Rather, we prefer to use the scores to make relative comparisons rather than absolute estimates.
How to assess personal fit #
While personal fit is not assessed in our problem profiles, it is relevant to your personal decisions. If you enter an area that you find totally demotivating, then you’ll have almost no impact. Within a field, the top performers often have 10 to 100 times as much impact as the median.
If you are comparing different problems you can use these extra scores to give a bonus to problems you are well suited to tackling.
Definition #
Given your skills, resources, knowledge, connections and passions, how likely are you to excel in this area?
How can it be assessed? #
- What’s your most valuable career capital? Is it especially relevant to one problem and not the others?
- How motivated do you expect to be if you worked on this problem?
- What specific roles could you take in this problem, and do you expect you’d excel at them?
Here’s our introductory advice on how to assess personal fit , and some further questions for making predictions .
Here’s a rubric you could use:
| Personal fit score | How well matched are your skills for this area? |
|---|---|
| 4 | You are exceptionally well-suited to the area. You are well-motivated and could be a world-leader in the field. |
| 2 | You are a reasonable fit for the field. Quite motivated and some relevant skills. |
| 0 | You are an actively bad fit for this field because you couldn’t be motivated to work on it or have no relevant skills. |
Note that the importance of personal fit depends on how you’re planning to contribute. A great entrepreneur or researcher has far more impact than an average one, so if you’re planning to contribute in either of those ways, personal fit matters a lot. However, if you’re earning to give, personal fit is less relevant because you’re sending money rather than your unique skills. So to assess personal fit in more depth, you could estimate your percentile in the field, then multiply by a factor that depends on the variation of performance in the field.
Bear in mind that it’s easy to underestimate the extent to which you can become knowledgeable and passionate about a new problem. We’re biased towards continuing with what we’ve done before— the ‘sunk cost fallacy’ —and we underestimate how much our preferences and passions will change .
Finally, remember that a single problem can often be tackled in multiple ways. If you want to work on global health, you could work on the ground in the developing world, conduct biomedical research, go into politics and many other options besides. If one isn’t a good fit for you, another might be.
Other factors for comparing career opportunities #
To come to an all considered view on whether to take a job, you also need to consider the other factors in our career framework , such as:
- How influential a role you can get.
- How much career capital you can get.
- The value of information of working on this option.
In this article, we only cover comparisons of problem areas, but that’s not all that’s relevant.
How should we interpret the results? #
If you’ve used our rubric above, you can add the scores together to get a rough answer of which problem will be more effective to work on. 2 Bear in mind that these scores are imprecise, and adding them increases the uncertainty even further, because we only measure each one imprecisely. This means you need to take your final summed score with a grain of salt – or rather a lot of salt.
Within 80,000 Hours, if the difference in score between two problems is 4 or larger, we have a reasonable level of confidence that it’s a more effective problem to work on. If the difference is 3 or smaller it looks more like a close call.
The scores we get when using this framework suggest that some problems are 10,000x more effective to work on than others. However, we don’t believe that the differences really are that large. For one, our scores have to be tempered by common sense judgements about the world. If the score for one problem seems very high, then it’s possible we’ve simply made a mistake and don’t realise it. For two, because the future is so unpredictable, work on problems that don’t seem pressing could turn out to be very useful in unexpected ways. That puts a limit on how much more pressing one problem can be than another.
Some other reasons for being modest about what such prioritisation research can show us are discussed here .
For more tips on making difficult judgement calls, take a look at our checklist .
How does this approach compare with ordinary cost-effectiveness analysis? #
What we want to know is this: ‘if I add an additional unit of resources to solving this problem, how much good will be accomplished’? The approach above looks at a problem from a bird’s eye view, and tries to assess how important it is to allocate more resources to solving it.
An alternative approach would be to look at the cost-effectiveness of past interventions to tackle different problems, and compare them directly against one another. For example, you could look at studies of different approaches we know about to improve education or health, and then calculate which one would help people more with an additional $1 million in funding. If this kind of cost-effectiveness data is available, and you already have a common outcome yardstick , this is a sensible approach. For instance, in health economics, people often calculate “QALYs per dollar” for different interventions.
If you’re comparing two problems that use different yardsticks, you can still compare them so long as you have a conversion factor, though the comparisons become much more uncertain. For instance, you could compare health interventions to climate change interventions by defining the rate at which you’d trade 1 QALY for 1 tonne of carbon dioxide averted. Our rubric in the scale section above shows roughly how we’d trade some yardsticks against others.
Alternatively you can try to convert all the benefits into dollar terms, and perform a ‘ cost-benefit analysis ’. This is expressed as a ratio of costs to benefits, both in dollars.
The main reason not to take this approach is that it’s extremely hard in many cases:
- Political advocacy, in which the circumstances you are working with are constantly shifting.
- Original research, where no-one knows how long it will take to make a new discovery.
- Any field in which no interventions are known, or the ones that we know about are not well studied.
It’s for this reason we have created the alternative framework above that can be applied to almost any problem.
Advantages and disadvantages of quantitative problem prioritisation #
There are several benefits to going through the process above:
- Explicitly quantifying outcomes can enable you to notice large, robust differences in effectiveness that might be difficult to notice qualitatively, and help you to avoid scope neglect .
- Going through the process of making these estimates is a great way to test your understanding of a problem, since it forces you to be explicit about your assumptions and how they fit together.
- A clearly laid out analysis can help others to understand and critique your reasoning, further helping you to understand the problem and how pressing it is.
But there is a major downside we need to keep in mind:
- In practice, these types of estimates usually involve very high levels of uncertainty. This means their results are not robust: different assumptions can greatly alter the conclusion of the analysis. As a result, there is a danger of being misled by an incomplete model, when it would have been better to go with a broader qualitative analysis, or simple common sense.
This is why we don’t simply go with the results of our scores. Rather, we consider other forms of evidence in our problem profiles to make an overall assessment.
For more on this topic, see GiveWell’s discussion of the weaknesses of ‘sequence thinking’ (which corresponds to an approach that’s heavily reliant on cost-effectiveness analysis) compared to ‘cluster thinking’. You can also see a discussion of the pros and cons of quantification .
How to factor in coordination? #
An individual can only focus on one or two areas at a time, but a large group of people working together should most likely spread out over several.
When this happens, there are additional factors to consider when choosing a problem area. Instead of aiming to identify the single most pressing issue at the margin, the aim is to work out:
- The ideal allocation of people over issues, and which direction that allocation should move in.
- Where your comparative advantage lies compared to others in the group.
We call this the ‘portfolio approach’. Read more .
Factoring in coordination can also have other effects on which problems to prioritise. For instance, it can be worth doing more work on an area than it first seems in order to compromise with or do moral trade with the other people you’re coordinating with. Read more .
Conclusion #
We’ve shown how to compare different problems on each of our framework factors – scale, neglectedness, solvability and personal fit.
While it is hard to measure effectiveness precisely, the differences identified between problems are often very large. This suggests that even inaccurate measurements could be a useful guide, compared to relying on intuition alone.
Further reading #
- Crucial considerations and wise philanthropy
- Take the portfolio approach to maximizing impact as a community.
Read next #
This is a supporting article in our key ideas series . Read the next article in the series.
This work is licensed under a Creative Commons Attribution 4.0 International License .
Comparing charities: How big is the difference? #
This is a linkpost for https://www.givingwhatwecan.org/charity-comparisons
Comparing charities: How big is the difference? #
Your donations can do an astonishing amount of good. However, the impact can vary wildly depending on where you donate.
The best charities can be at least ten times better than a typical charity within the same area, hundreds of times better than poor-performing charities, and the worst charities can do harm.

Intervention cost-effectiveness in global health in order of DALY per $1,000 on the y-axis, from the DCP2. Compiled from The Moral Imperative Towards Cost Effectiveness by Toby Ord .
This page contains some out-of-date information. We hope to update it as soon as we can, and still believe that the core argument is correct. For a more recent analysis of this topic, see 80,000 Hours’ article: “ How much do social problems differ in their effectiveness? A collection of all the studies we could find. ”
Comparing charities #
Imagine you had $100 to spend to help improve school attendance of school children in low-income countries. How many additional years of school could that buy?
Providing merit scholarships for girls would result in about a month or two of school attendance (0.15 years). That would seem like a pretty good deal, right? However, if you spent that $100 on school-based deworming treatments it would result in about 14 years of school – that’s almost one hundred times more schooling.
Furthermore, that same deworming program could give an extra year of healthy life for roughly $28-$70 (according to charity evaluator GiveWell). In comparison, new cancer drugs are generally recommended in Australia if their cost per year of healthy life saved is around $45,000-$75,000. A factor of almost one thousand.
At least merit scholarships and new cancer drugs have positive effects – they still improve schooling and save lives. That isn’t always the case. Suppose you were to spend that same $100 on trying to prevent juvenile offending using the “Scared Straight” program. In that case, it’s estimated that would have a negative effect, costing society $29,300 for that $100 invested.
We’ve collated a list of examples at the bottom of this page, but first…
Is this surprising? #
Most people find this surprising, but it probably shouldn’t be. We’re used to seeing uneven distributions in all kinds of fields:
- The most profitable businesses are many many times more profitable than the average business.
- A bestselling author far outsells the average author.
- Many investments lose money while some return 1,000 times the initial investment
Furthermore, charities don’t have the same competitive dynamics as the private sector because it isn’t the beneficiary that pays for the intervention. If one company is charging $10,000 for a laptop and another company is charging $1,000 for a better laptop, the first company wouldn’t survive long. However, a donor will often donate the same amount regardless of the impact.
Does this matter? #
Yes, it has a real tangible cost. We just notice it less when it’s affecting others (especially if they’re far away in distance or time, or otherwise different enough from us).
When reading numbers that affect others the only difference between 1 and 100 is two little zeros – it doesn’t feel significant. Our brains don’t really intuitively have an emotional sense of scale (psychologists call this phenomenon scope insensitivity ).
To get a sense of scale it can help to try and picture the impact very personally.
Take a moment to _ slowly_ read and _ imagine_ each of these examples:
- You need a life-saving surgery that costs $500,000. Then you find there is another procedure that’s just as effective for only $5,000.
- Your partner is diagnosed with a disease and they only have an 8% chance of surviving with the standard procedure. Then you are told there’s an alternate procedure for the same cost that increases their chances of living to 80%.
- Your beloved family pet is diagnosed with a disease and is only expected to live for 6 months with standard treatment. You find out that you can have an alternate treatment that will give them 6 years of excellent life.
- Your entire family is stranded with a bushfire raging towards you and only have a small motorbike to escape. Then a person driving an empty minibus comes by to rescue you.
Notice that initial dropping of the stomach, followed by an amazing sense of relief? That is what 10x-100x feels like.
The good news is that:
- Outstanding giving opportunities can be found; and
- Many of us are fortunate enough to have significant resources to put to good use (most people reading this would be on the global rich list ).
A typical American who donated 10% of their income to an effective charity could choose to save an estimated 40 lives over their career (e.g. ~45 years, ~$50k income, ~$5,500 per life saved donating to Against Malaria Foundation according to GiveWell’s estimate).
It’s amazing how we can significantly improve the lives of others if we use our resources effectively.
What can we do? #
Charity evaluation is a difficult task for most donors to do on their own, so we’ve put together our giving recommendations to help you get started.
If you’re convinced that it’s important to improve the lives of others, consider taking a pledge to donate a meaningful portion of your income to help improve the lives of others. It can help you live up to your values, meet like-minded people, and inspire others to follow suit.
If you’re driven to have an impact, you may also be able to significantly help others by pursuing a high-impact career , volunteering, or advocating for effective ways of improving the world.
More effective ways to help others
Charity cost-effectiveness comparisons #
We’ve collated the following table of examples which illustrate this underlying point by drawing comparisons with publicly available data.
However, there are some things worth noting:
- The best giving opportunities are often hard to precisely quantify.
- You can find much larger gains when comparing a much wider set of options ; e.g. * Instead of treating similar conditions in a more effective way, you could treat a different condition; * Instead of focusing on the wellbeing of people alive today, you could focus on the wellbeing of future generations or animals.
- These numbers are estimates from a range of sources and times, and use varying statistical methods.
- We don’t necessarily recommend all of the charities used in the ‘more effective’ examples below.
- These estimates generally look at the charities average cost-effectiveness (the ratio between all the benefits they provide divided by all their costs), which is likely to differ from the marginal cost-effectiveness (the ratio between all the benefits gained from an additional donation, divided by the size of that donation). We think donors should primarily be interested in marginal cost-effectiveness.
| More Effective | Less Effective | Difference |
|---|---|---|
| Cataract Surgery ~$1,000/ severe visual impairment reversed | Seeing Eye Dogs ~$40,000/ blind person served | ~40x for somewhat similar outcome |
| Antimalarial Bednets ~$10,000 per 2 deaths averted | Make A Wish ~$9,000/ wish granted | Similar cost for vastly different outcome |
| Chlorine Dispensers ~$2 per diarrhoeal incident avoided | Hand Washing Promotion + Free Soap ~$14 per diarrhoeal incident avoided | ~7x for same outcome |
| The Humane League corporate campaigns + activities ~$1,000 per 100,000 farm animal lives improved | Animal shelters rescue ~$1,000 per 2.45 dogs/cats rescued | ~40,000x for similar outcome with different animals |
Examples of charities that do harm (negative cost-effectiveness) #
- The Scared Straight programme is estimated to have cost society ~$293 per $1 invested (the intervention has increased juvenile offending)
- Play Pumps each cost ~$14,000 and are reported to have been much worse than the cheaper hand pumps they replaced
What are the best and worst charities to donate to? #
The best charities are ones that are evaluated to be highly impactful — they work on an important problem and do the most good with the resources they have. The worst charities are ones that actively harm those whom they intend to help, or society at large.
Join our effective giving community #
If you’ve made it this far, we hope you’re inspired to give more, and to give more effectively.
Join the Giving What We Can community by taking a pledge to donate a meaningful portion of your income to help improve the lives of others. It can help you to live up to your values, meet like-minded people, and inspire others to follow suit.
Not ready to pledge? You can also donate to an effective charity , sign up to our newsletter , read our blog , attend an event , join an effective altruism group , or get in touch if you’d like to discuss anything.
If you have any updated figures or examples to add to this page, please contact us to let us know.
This work is licensed under a Creative Commons Attribution 4.0 International License .
Marginal Impact #
This is a linkpost for https://www.probablygood.org/post/marginal-impact
Fermi Estimate #
This is a linkpost for https://forum.effectivealtruism.org/topics/fermi-estimate
A Fermi estimate (or back-of-the-envelope calculation , often abbreviated BOTEC ) is a rough calculation that aims to be right within about an order of magnitude, prioritizing getting an answer good enough to be useful without putting the large amounts of thought and research needed to attain greater accuracy. Fermi estimates typically approximate an answer by making various simplifying assumptions and decomposing the problem into smaller tractable units. Open Philanthropy and other organizations in the effective altruism community routinely use BOTECs for impact assessment and cause prioritization .
Further reading #
Berger, Alexander (2014) Alexander’s back of the envelope “importance” calculations , GiveWell.
Muehlhauser, Luke (2013) Fermi estimates , LessWrong , April 11.
von Baeyer, Hans Christian (1988) How Fermi would have fixed it , The Sciences , vol. 28, pp. 2-4.
Related entries #
cause prioritization | expected value | forecasting | impact assessment | model uncertainty | prediction markets | value of information
If you want to try your hand at making some Fermi estimates, you can play The Estimation Game . New games are released each month, and you can play the previous months’ games in the archive.
This work is licensed under a Creative Commons Attribution 4.0 International License .
The number of seabirds and sea mammals killed by marine plastic pollution is quite small relative to the catch of fish #
Disclaimer: plastic pollution may well kill way more animals besides seabirds and sea mammals. There are 6.2010^14 wild fish and 1.0010^20 wild marine arthropods , but only 6.75*10^11 wild mammals.
Summary #
- 1 kg of plastic is emitted to the ocean per capita per year1.
- 0.0001 seabirds and 0.00001 sea mammals are killed by marine plastic pollution per capita per year.
- 200 wild fish are caught per capita per year.
- The catch of wild fish is 2 M times as large as the number of seabirds, and 20 M times as large as the number of sea mammals killed by marine plastic pollution.
The data and calculations are presented below.
Data #
- The plastic emitted to the ocean in 2010 was 8 million tonnes according to OWID (PEO = 8 M t ).
- The world population in 2010 was 6.92 billion according to The World Bank (WP = 6.92 G ).
- Marine plastic debris kills up to 1 million seabirds and 100 thounsand sea mammals each year according to the United Nations (SB = 1 M, and SM = 100 k).
- The catch of wild fish is 0.97 to 2.7 trillion/year according to fishcount.org (WFL = 0.97 T /year to WFH = 2.7 T/year).
Calculations #
- Plastic emitted to the ocean per capita in 2010 (PEOpC): PEO / WP = 8 Gkg / (6.92 G) = 1.16 kg.
- Plastic emitted to the ocean to cause one death of a seabird (PEOpDSB): PEO / SB = 8 Mt / (1 M) = 8 t.
- Plastic emitted to the ocean to cause one death of a sea mammal (PEOpDSM): PEO / SM = 8 Mt / (0.1 M) = 80 t.
- Seabirds killed by plastic marine pollution in 2010, per capita (DSBpC): PEOpC / PEOpDSB = 1.16 / (8 k) = 145 μ (145 seabirds killed per million people).
- Sea mammals killed by plastic marine pollution in 2010, per capita (DSMpC): PEOpC / PEOpDSM = 1.16 / (80 k) = 14.5 μ (14.5 sea mammals killed per million people).
- Wild fish caught per year (WF): (WFL * WFH)^0.5 = (0.97 * 2.7)^0.5 T = 1.62 T.
- Catch of wild fish per capita per year (WFpC): WF / WP = 1.62 T / (6.92 G) = 234.
- Ratio between the catch of wild fish and the number of seabirds killed by marine plastic pollution: WFpC / DSBpC = 234 / (145 μ) = 1.62 M.
- Ratio between the catch of wild fish and the number of sea mammals killed by marine plastic pollution: WFpC / DSMpC = 234 / (14.5 μ) = 16.2 M.
This work is licensed under a Creative Commons Attribution 4.0 International License .
Global economic inequality #
This is a linkpost for https://ourworldindata.org/global-economic-inequality-introduction
What is most important for how healthy, wealthy, and educated you are is not who you are, but where you are. Your knowledge and how hard you work matter too, but much less than the one factor that is entirely outside anyone’s control: whether you happen to be born into a productive, industrialized economy or not.
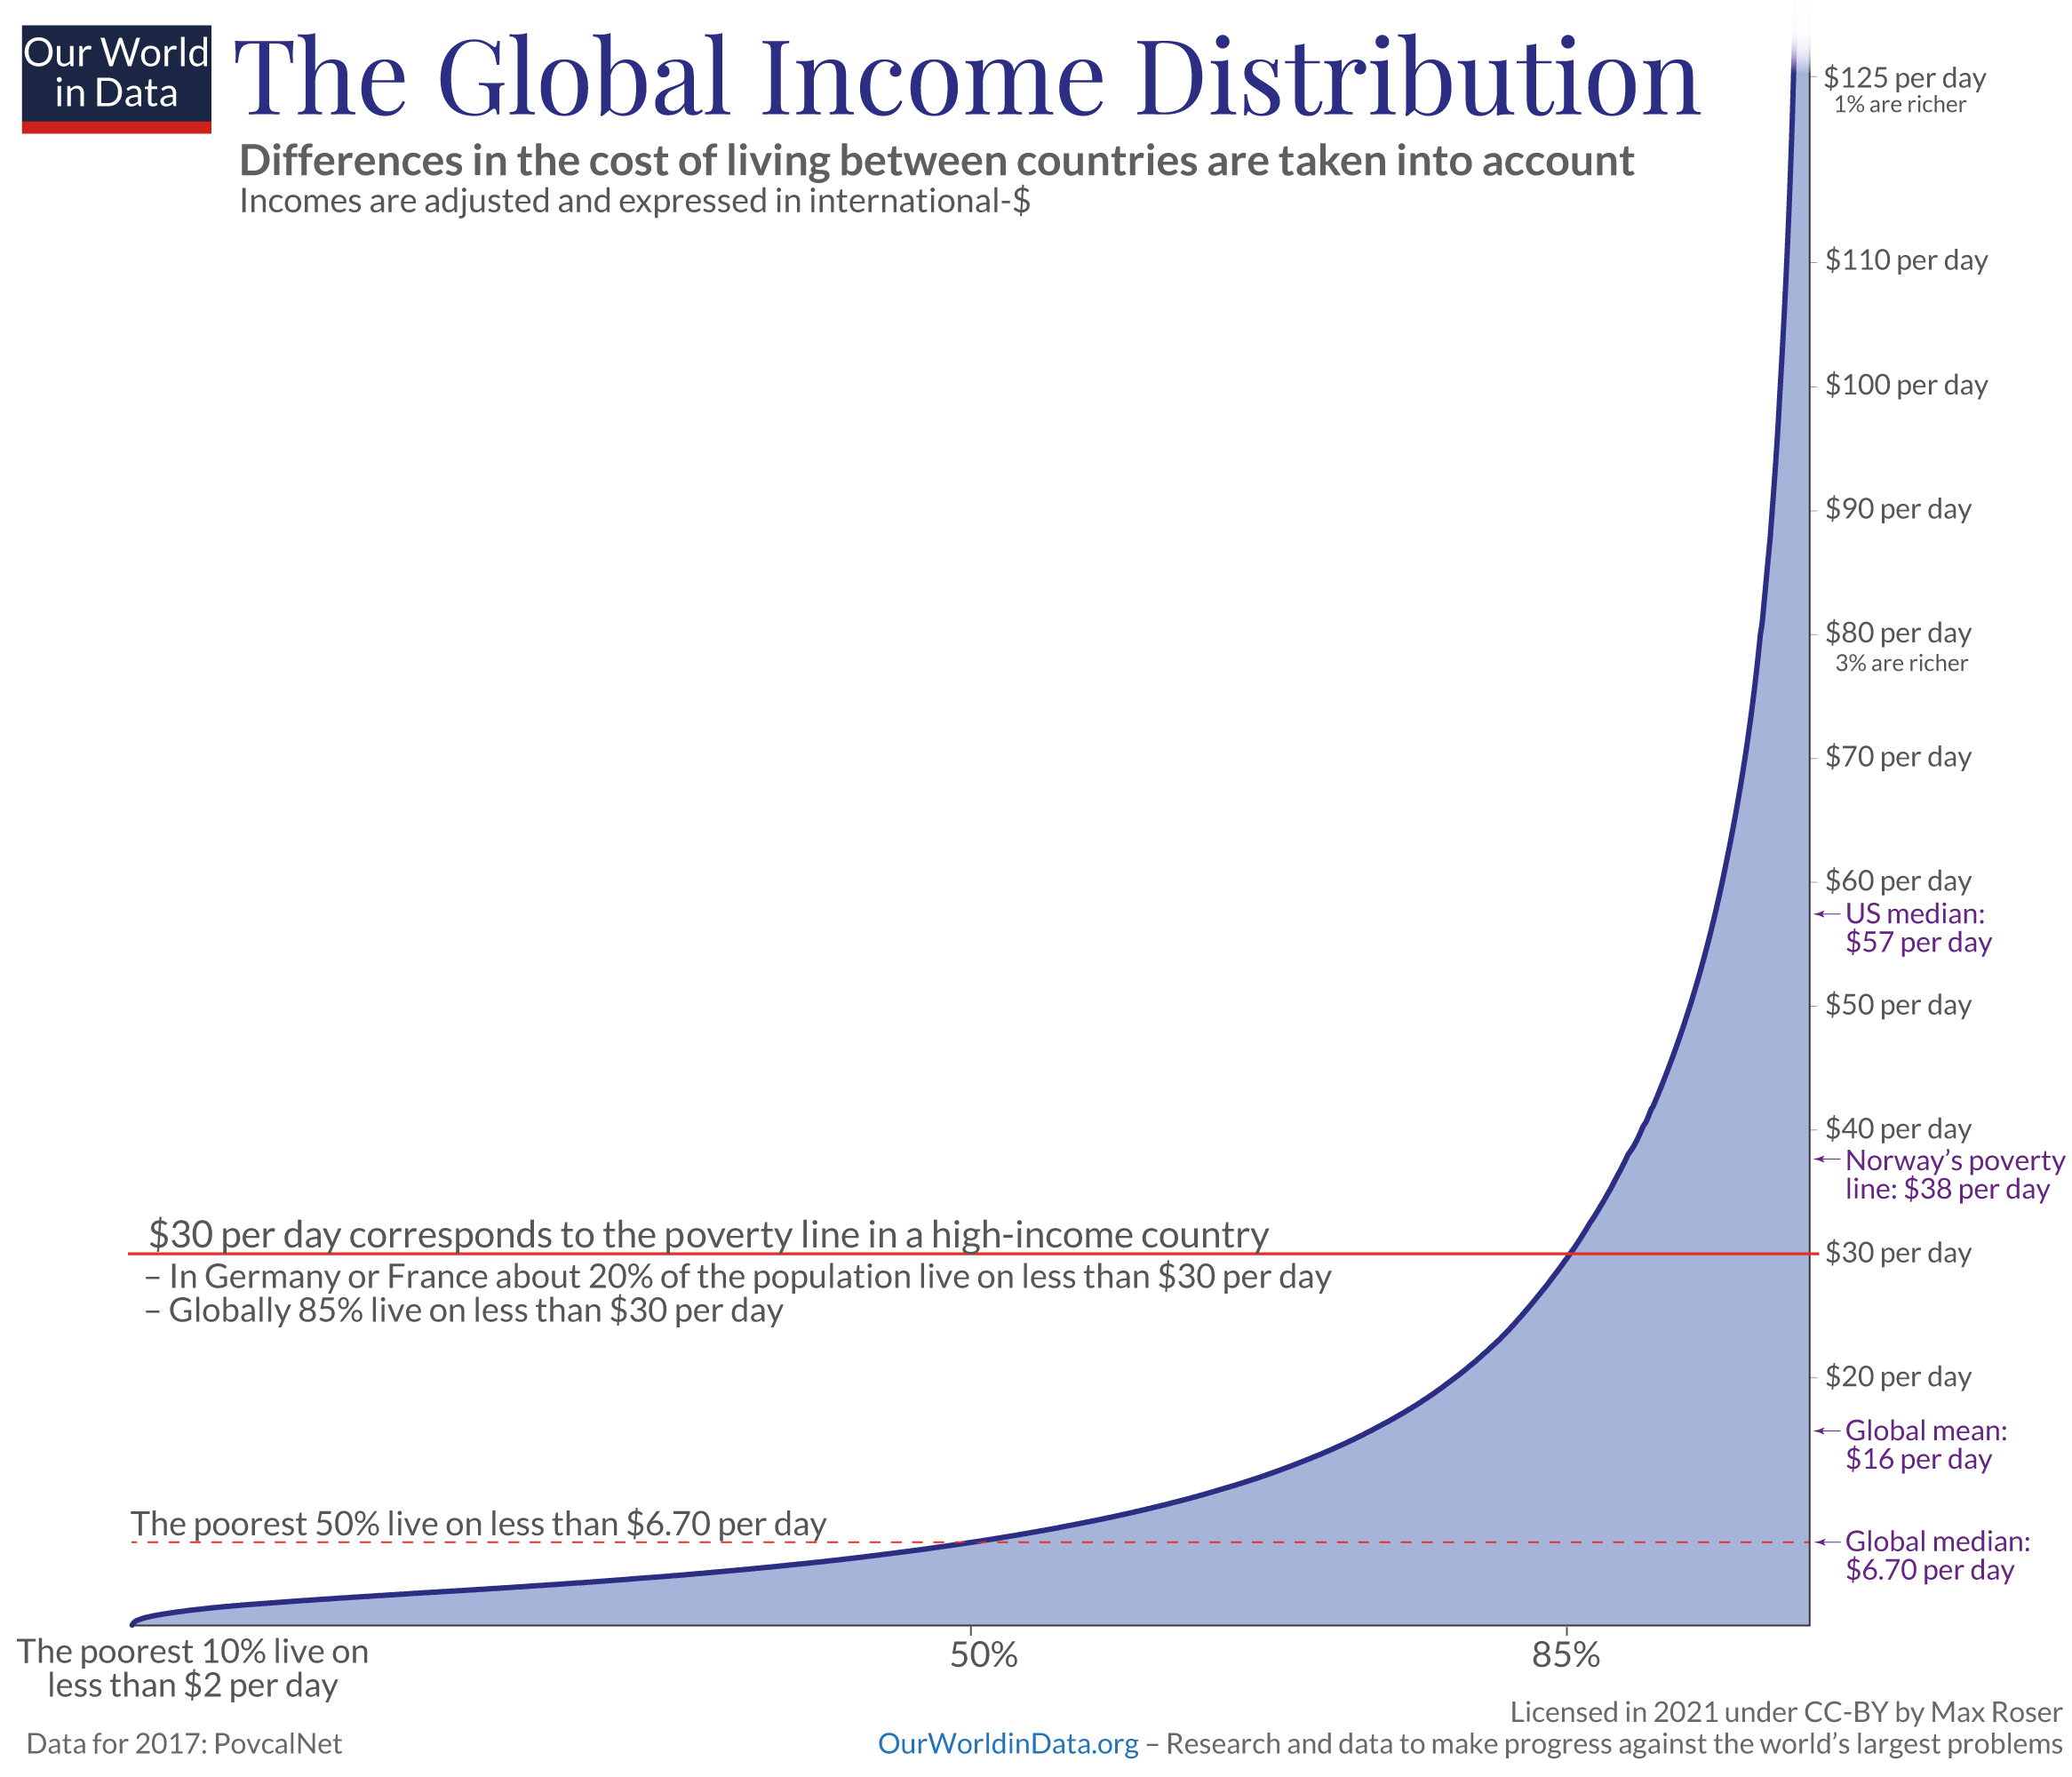
Global income inequality is vast. The chart shows this. As all data throughout this text it takes into account the differences in the cost of living.
The huge majority of the world is very poor. The poorer half of the world, almost 4 billion people, live on less than $6.70 a day.
If you live on $30 a day you are part of the richest 15% of the world ($30 a day roughly corresponds to the poverty lines set in high-income countries).
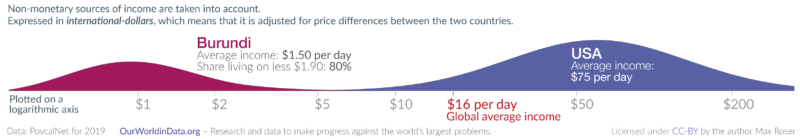
Inequality can be very high within countries, the US – a high-income country with extraordinary large inequality – is a prime example of this. But much of global inequality is inequality between countries. The small chart shows this by comparing the income distribution of the US with the distribution in Burundi.
Vast economic inequality means vast inequalities in living conditions #
The large economic inequality is only one dimension of global inequality. There are many other aspects that people care about.
But because a high income is so important for good living conditions these other inequalities map onto the economic inequality. Those who live on higher incomes have advantages in many ways.
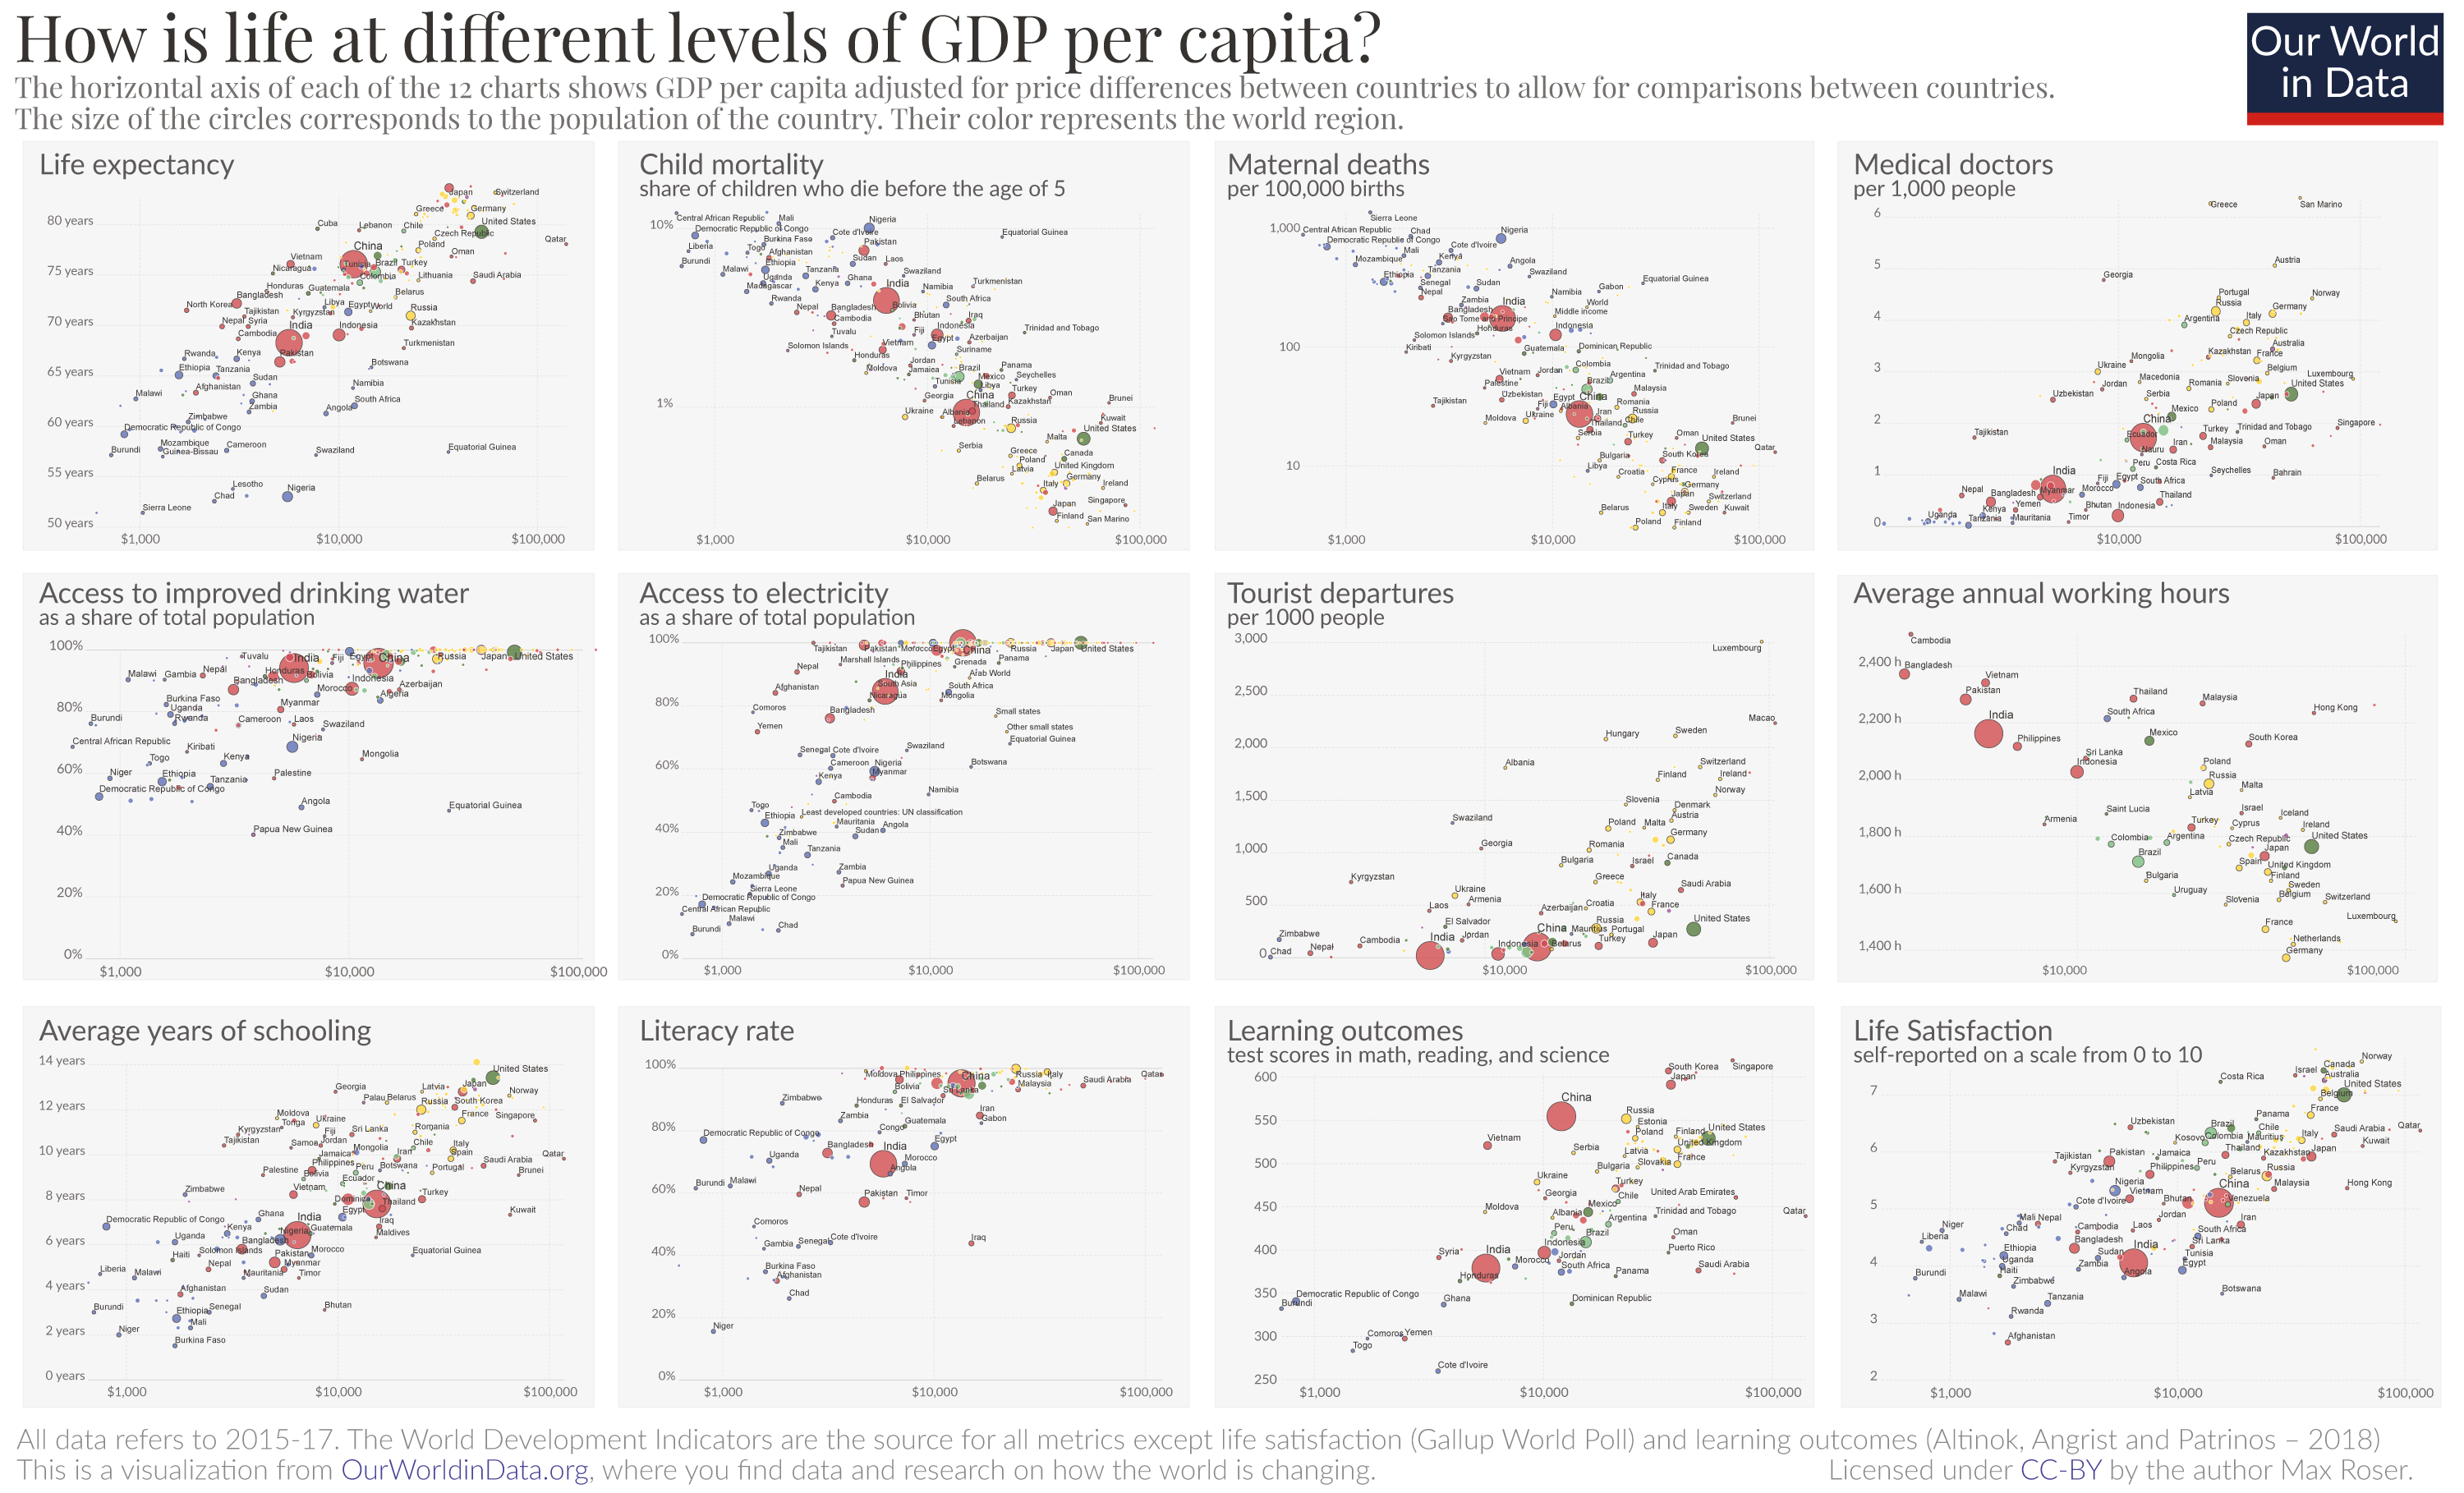
The chart shows what life is like on different income levels in 12 different dimensions.
On the horizontal axis in each panel you see GDP per capita, measuring the average income in a country. Starting from the top left these panels show that where incomes are higher people live longer, children die less often, mothers die less often, doctors can focus on fewer patients, people have better access to clean drinking water and electricity, they can travel more, have more free time, have better access to education and better learning outcomes, and people are more satisfied with their lives.
The inequality of people’s living conditions mirrors the world’s economic inequality.
It is hard to overstate how very large these differences are. Life expectancy in the poorest countries is 30 years shorter than in the richest countries. I have also just written about the very large global inequalities in learning outcomes along the economic dimension.
Where a person finds themselves in the extremely unequal global income distribution is mostly determined by where they are #
Seeing how much our living conditions depend on the productivity of the economy we live in should matter hugely for our own self-understanding and our view of others. In a world of such vast inequalities between countries it is not who a person is that determines whether they are well-off or poor, but where a person is.
To see this, consider a world without any inequality between countries. If all countries were equally rich, where someone would live would not matter at all for where someone ends up in the global income distribution.
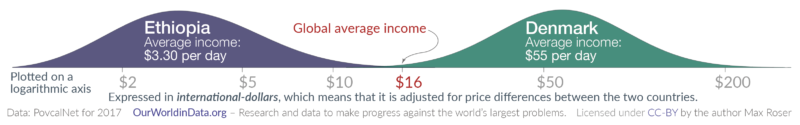
In contrast, consider a situation of extreme inequality between countries, such as today’s inequality between a poor and rich country. 1 In this case the home country of a person determines everything. The shown data for Ethiopia and Denmark makes this clear: the two distributions basically don’t overlap at all, a person born in Denmark has almost certainly an income above the global average, someone born in Ethiopia has almost certainly an income lower than that.
Beyond just two countries, how much does a person’s home country matter for where they are in today’s global income distribution?
Inequality researcher Branko Milanovic studied this question and found that the country where a person lives explains two-thirds of the variation of income differences between all people in the world. 2 Where a person lives is the most important factor of their income.
For a variety of reasons – from family ties to the political restrictions that impede migration – very few people move between countries. The vast majority of the world population [ 97% ] live in the country they were born in. And so for most people in the world, it is not only the country they live in that determines their income, but it is the country they were born in.
All of this is not to say that a person’s work ethic, talent, and skills do not matter for their income. They do. But it is to say that all these personal factors together matter much less than the factor that is entirely outside of a person’s control: whether they are born into a large, productive economy or not.
Where you live isn’t just more important than all your personal characteristics, it’s more important than everything else put together.
The importance of redistribution and economic growth for reducing global inequality and better living conditions #
The data I discussed highlights three important facts about our world:
- the extent of global economic inequality is vast;
- economic prosperity is immensely important for people’s living conditions;
- and where a person finds themselves in the unequal global income distribution is largely outside of their control.
What can we take away from these three insights?
Redistribution #
Redistribution through the state plays a large role in reducing inequality within countries and could also reduce global inequality. However, the reality is that, no matter in which rich country you pay your taxes, almost none of that goes to the world’s poor people. 3 The redistribution that governments do is not reaching the poorest people: it is domestic not international redistribution.
If you want to reduce global inequality and support poorer people, you do however have this opportunity. You can donate some of your money.
You might be able to live on a little less and this money could make a big difference to a poorer person.
The most direct way is to send some of your money directly to very poor people, the non-profit organization GiveDirectly makes this possible. Or you can donate to an effective charity that supports the world’s poorest. At the footnote you find out how to find such a charity and how I donate. 4
Economic growth #
Some suggest we can end poverty without additional growth by simply reducing global inequality. This is not the case. Reducing global inequality can achieve a lot, but it is important to be clear that redistribution alone would still mean that billions of people would live in very poor material conditions. The world is far too poor to end poverty without large growth.
To achieve a more equal world without poverty the world needs very large economic growth. 5
We can see this when we look at our global history. Two centuries ago the world was much more equal: Average income, measured with GDP per capita in the chart, was low everywhere and the huge majority of people was extremely poor .
Since then some countries have achieved very large growth – Swedes are for example about 30-times richer than two centuries ago – while other economies hardly grew at all. This unequal development resulted in the extremely large global inequality of today.
The reality of today’s global inequality is cruel. Those who are born into an economy that achieved large growth in the last two centuries grow up in much better living conditions than those who happen to be born into a poor economy. Economic growth for billions of people in poverty is what we need to end this injustice.
Those places that have achieved large growth show how much better the living conditions can be for all.
To take one concrete example, let’s consider maternal mortality. In high-income countries, where mothers can rely on well-equipped hospitals and support from doctors and midwives when complications occur, maternal deaths have become rare (the risk of death has declined 300-fold in the last generations). But in the rest of the world it is still very common: every year 295,000 mothers die just in that moment when they give life to their child.
What would the world look like if the risk of death for mothers was globally as low as in the world’s richest countries? The huge majority of mothers who die this year would survive. 6

We know that this is possible. This is what the historical perspective makes clear; all places that have good living conditions today were extremely poor until just a few generations ago.
Conclusion #
What we have seen in the data here is one of the most important insights of development economics: people live in poverty not because of who they are, but because of where they are. A person’s knowledge, their skills, and how hard they work all matter for whether they are poor or not – but all these personal factors together matter less than the one factor that is entirely outside of a person’s control: whether they happen to be born into a large, productive economy or not.
What gives people the chance for a good life is when the entire society and economy around them changes for the better. This is what development and economic growth are about: transforming a place so that what was previously only attainable for a few comes into reach for all.
Continue reading on Our World in Data:
How much economic growth is necessary to reduce global poverty substantially?
Acknowledgements: I want to thank Joe Hasell and Toby Ord for their feedback on this article and visualizations.
This work is licensed under a Creative Commons Attribution 4.0 International License .
GiveWell’s “Giving 101” guide #
This is a linkpost for https://www.givewell.org/giving101
The key principles we recommend you keep in mind when deciding where to give:
Your donation can change someone’s life. #
For a few thousand dollars or so, you can save or improve someone’s life in the developing world. This claim isn’t a normal “marketing pitch” you read in direct mail solicitations—it’s the result that outstanding charities achieve. For more, see:
The wrong donation can accomplish nothing. #
Charities that demonstrably change lives are the exception, not the rule. Why? Fundraisers often rely on social connections or emotional pleas, and almost never make fact-based demonstrations of programs’ effectiveness. This means that lots of charities raise money and run programs without ever demonstrating that their programs actually work. Why should charities have to demonstrate that their programs work?
Experts, governments and foundations have tried (and often failed) for decades to solve many of the same problems charities are working on today. This means that many charities may not be accomplishing anything at all. For more, see:
Your dollar goes further overseas. #
Ultimately, there’s no “right” answer to the question of which cause you should support. As you consider that decision, it’s worth recognizing that the impact you can have with your donation varies greatly between causes. If you focus on education in New York City, it costs over $100,000 to educate a student throughout 12 years of school. When supporting international aid, you can save a person’s life for a few thousand dollars or so.2 That doesn’t mean you should necessarily support international aid, but, just like any time you spend your money, it’s important to know what you’re getting. For more, see:
This work is licensed under a Creative Commons Attribution 4.0 International License.
Global health #
This is a linkpost for https://ourworldindata.org/health-meta
Introducing LEEP: Lead Exposure Elimination Project #
We are excited to announce the launch of Lead Exposure Elimination Project ( LEEP ), a new EA organisation incubated by Charity Entrepreneurship. Our mission is to reduce lead poisoning, which causes significant disease burden worldwide. We aim to achieve this by advocating for lead paint regulation in countries with large and growing burdens of lead poisoning from paint.
In this post, we make the case for lead exposure reduction as a priority, and outline our plan to address this problem.
The Problem #
Others in the effective altruism community have already identified that working on lead poisoning could be a high-impact opportunity (see here , here , and here ). Through the Importance, Tractability, Neglectedness framework , we unpack the reasoning for prioritising lead exposure interventions, and for our approach of advocating for the introduction of lead paint laws.
Importance
Lead poisoning has substantial health and economic costs, and lead paint is a primary contributor [1]. In terms of individual impacts, lead exposure has a number of effects. Even a low level of lead exposure can lead to mental disability and IQ loss, as well as increased rates of mental illness and psychopathology and significantly reduced lifetime earnings capacity [2, 3, 4]. Lead also has effects on behaviour and criminal tendencies; in particular having a large impact on the prevalence of violent crime [5]. In adults, lifetime lead exposure is an important risk factor for renal disease and cardiovascular disease, including hypertension and coronary artery disease [6, 7]. Higher levels of exposure can affect all organ systems, and even result in respiratory difficulties, seizure, coma, and death [5].
Lead poisoning primarily affects children, and does so at a massive scale. UNICEF reports that 815 million children have blood lead levels above 5 µg/dL - a sufficient level for neurodevelopmental effects and reduced IQ [8]. The vast majority live in low and middle-income countries. Put another way, one in three children are currently affected by lead poisoning to some degree.
In addition to disability, it also causes 1 million deaths per year. In total, lead poisoning accounts for 22 million DALYs every year, which means that lead poisoning is responsible for approximately 1% of the global disease burden [9].
In terms of lost earnings, lead poisoning impacts the world economy to the level of approximately $1 trillion per year [4]. This amounts to a loss of 1.2% of world GDP. These losses are concentrated in low and middle-income countries, where they can amount to as much as 5-8% of GDP , suggesting that lead exposure can be a significant barrier to economic development and poverty reduction.
In short, the problem of lead poisoning is a significant one.
Neglectedness
At present, while all countries except for one have banned leaded petrol, 61% of countries have no lead paint regulations whatsoever [1]. In many of these primarily low and middle-income countries the burden of disease from lead poisoning is still significant . In high-income countries, this is a less severely neglected area, as most countries have introduced regulations banning leaded petrol and lead paint.
While there are some organisations working to address this issue in low and middle-income countries, including IPEN, ToxicsLink, and Pure Earth, many countries with significant lead burdens remain neglected by other actors. LEEP aims to fill this gap, and target these neglected countries.
Tractability
This is the most uncertain aspect of working on lead poisoning, given the uncertainty around the success of policy change interventions. However, there are several reasons in favour of the tractability of policy change to ban the production and import of lead paint.
- Experts suggest that lead paint may be the most tractable source of exposure to address and the easiest to regulate. Lead paint is a major source of exposure to lead, but other sources include batteries, mining, foodstuffs, pipes, and cookware [1].
- There is broad agreement that the introduction of legislation is the most effective way to reduce exposure to lead paint [10].
- Switching to unleaded paints is technically and economically viable for manufacturers [10].
- NGOs have so far been successful in introducing new lead paint laws in 21 low and middle-income countries, demonstrating a precedent for feasibility [11].
- The presence of opposition can often make policies harder to pass [12]. One of the strengths of lead paint regulation as an intervention is that it exists in a virtually unopposed political environment. There is no significant lead paint lobby that might oppose regulation, and in some cases the paint industry has even supported the introduction of regulation.
- Lead paint regulation would have obvious benefits to political decision-makers due to its very low costs and significant long-term benefits for our target countries. It has been estimated that every dollar spent in lead paint hazard control results in a return of $17-$221 [5].
- Lead paint is typically a non-partisan issue, making political opposition less likely.
In addition to the direct impacts of our work, we hope that our intervention will provide further evidence to the tractability of policy interventions.
Our Plan #
Our first priority is country selection to ensure we target tractable, high-burden, and neglected countries. We have identified Malawi as the most promising country on this basis. Over the next two months, we will be testing the levels of lead in new paints on the market in Malawi and building relationships with stakeholders and decision-makers. Depending on findings and progress from this stage, we will either pilot our advocacy campaign in Malawi to introduce lead paint regulation, or pivot to another promising country.
We plan to advocate for evidence-based policy change while rigorously tracking our counterfactual impact, in alignment with the principles of the EA movement. In this process, we will publish our full findings on our website so that they can be used by other organizations or individuals working on lead poisoning (or policy change more broadly).
In our preliminary cost-effectiveness analysis, we found that this intervention has the potential to be highly cost-effective, currently comparable to GiveWell’s top charities. Ultimately, lead policy seems to be an area that has the potential to be more cost-effective than the most effective existing charities in global health and development.
Though we will initially focus all of our efforts on one target country, our long-term goal is to introduce lead regulation in a number of high-burden countries, and reduce lead poisoning at an international scale.
How You Can Help #
What can you do if you want to contribute to our mission?
Advisors
We are currently being mentored and advised by the Charity Entrepreneurship team, as well as by the founders of Fortify Health, but are also seeking further advisors. Specifically, we are looking to connect with experts involved in lead regulation or other forms of political advocacy. If you have experience in any of these fields we would love to connect with you.
We are also seeking advisors who have connections or in-country experience in our top few target countries. If you have connections in Malawi, Madagascar, Sierra Leone, Burkina Faso, or Guatemala, we would love for you to get in touch.
Hires
We plan to hire in-country staff during our first year in our target location. In future years, we may seek interns or employees for operations, research, and communications roles.
Funding
Charity Entrepreneurship has awarded us a seed grant of $60,000, which will enable our organisation to operate for most of our first year.
We will be seeking further funding, and would love to be in contact with risk-tolerant donors looking to support early stage organisations
Follow our work
If you would like to be kept updated by our work then please sign up to our newsletter , and follow us on Facebook , Twitter and Linkedin .
Feedback
We greatly value your feedback and suggestions, particularly at this early stage. Please feel free to post your questions or comments below or reach out to us directly through our contact form .
LEEP was incubated under Charity Entrepreneurship , an effective altruism organization, which provided our initial funding with a $60,000 seed grant. Our current team members are co-founders Jack Rafferty and Lucia Coulter.
References #
- UNEP 2019: Update on the global status of legal limits on lead in paint. September 2019
- Lamphear et al. 2oo5: Low-level environmental lead exposure and children’s intellectual function: an international pooled analysis
- Reuben et al. 2019: Association of childhood lead exposure with adult personality traits and lifelong mental health
- Attina & Trasande 2013: Economic costs of childhood lead exposure in low-and middle-income countries
- Gould 2009: Childhood lead poisoning: Conservative estimates of the social and economic benefits of lead hazard control
- Chowdhury et al. 2018: Environmental toxic metal contaminants and risk of cardiovascular disease: systematic review and meta-analysis
- Lanphear et al. 2018: Low-level lead exposure and mortality in US adults: a population-based cohort study
- UNICEF 2020: The Toxic Truth
- IHME 2017: Global Burden of Disease Study
- WHO 2020: Global elimination of lead paint: why and how countries should take action: technical brief
- Charity Entrepreneurship 2020: Lead Paint Regulation
- Baumgartner et al. 2009: Lobbying and Policy Change: Who wins, who loses, and why?
This work is licensed under a Creative Commons Attribution 4.0 International License .
Exercise for ‘Differences in Impact’ #
Part A (20 mins.) #
In this exercise, we’ll imagine that you’re planning to donate to a charity to improve global health, and explore how much you could do with that donation.
GiveWell is an effective altruism-inspired organization which attempts to identify outstanding donation opportunities in global health and development. Using this tool to estimate your future income and Givewell’s reports on their top charities , try and work out what you could achieve if you donated 10% of your lifetime income to one of these charities.
If you’re short on time, here’s a sheet with information about three top GiveWell charities . If you’d like to explore further, check out GiveWell’s cost effectiveness models .
Complete this exercise for three GiveWell charities, writing down your answer like, e.g.:
Malaria Consortium: X cases of malaria prevented, with an estimate of N deaths averted
#
Part B (10 mins.) #
In the last section, you ended up with a few different options. Now imagine you were given $1,000 to donate to o nly one of these charities.
There’s a difficult judgment to be made now: since you have to pick, which charity would you donate to to do the most good?
Now write down your answer to the following questions:
Which charity do you pick to donate to? Why?
Part C (Optional, 10 mins.) #
What are other decisions in your life that you might consider generating quantitative estimates and comparing outcomes for?
More to explore on ‘Differences in Impact’ #
GiveWell and Open Philanthropy #
GiveWell and Open Philanthropy are sister organizations in the effective altruism community. Both seek to identify outstanding giving opportunities, but they use different criteria and processes.
GiveWell has an emphasis on evidence-backed organizations within the global health and wellbeing space, while Open Philanthropy also supports high-risk, high-reward work, as well as work that could take a long time to pay off, in a variety of cause areas. We think this illustrates interesting methodological differences between attempts to answer the question “How can we do the most good?”.
- Our Criteria - GiveWell and Process for Identifying Top Charities - GiveWell (20 mins.)
- Alexander Berger on Global health and wellbeing (3 hours)
- Hits-based Giving - Open Philanthropy (45 mins.)
Cost-effectiveness methodology #
- The moral imperative towards cost-effectiveness (10 mins.)
- Prospecting for Gold (55 mins.)
- Finding the best charity requires estimating the unknowable. Here’s how GiveWell does it. (Podcast - 1 hour 45 mins.)
- Why we can’t take expected value estimates literally (even when they’re unbiased)
- List of ways in which cost-effectiveness estimates can be misleading - A checklist of things to keep in mind when using cost-effectiveness estimates. (25 mins.)
- One approach to comparing global problems in terms of expected impact - 80,000 Hours - An outline of a more precise and quantitative version of the importance, neglectedness, and tractability framework; and details on how to apply it yourself (30 mins.)
- A framework for comparing global problems in terms of expected impact - 80,000 Hours (25 mins.)
- Subjective Confidence Intervals - Animal Charity Evaluators (10 mins.)
- RCTs in Development economics, their critics and their evolution (18 mins.)
- How to Measure Anything , Chapter 1 and 2 (50 mins.)
Mental health or physical health? #
- Donating money, buying happiness and Happiness for the whole household - (30 mins. between them) A cost effectiveness analysis that suggests that psychotherapy may be 9 times more effective than cash transfers (and thus competitive with GiveWell’s top charities).
- Using Subjective Well-Being to Estimate the Moral Weights of Averting Deaths and Reducing Poverty (52 mins.) - Argument that subjective well-being is a better metric for determining value than physical health or wealth.
- Health in poor countries problem profile (10 mins.)
- South Asian Air Quality Cause Investigation (18 mins.)
Other newer strategies for improving human wellbeing #
- Wave is a startup that is now the largest mobile money service in Senegal. Some of Wave’s founders and early employees worked on it because they believe that it’s an extremely effective way to improve the world .
- Ben Kuhn, Wave’s CTO makes the case for founding a startup that serves emerging markets generally being an effective way of improving people’s lives .
- Many people in the developing world commit suicide by drinking pesticide. It seems that we can significantly reduce suicide rates if we ban the more dangerous sorts of pesticide .
- Charity Entrepreneurship has incubated a number of charities in this space, focused on interventions that they think could be highly effective. These include:
Effective aid #
- The lack of controversy over well-targeted aid - GiveWell (10 mins.)
- Growth and the case against randomista development - An argument that research on and advocacy for economic growth in low- and middle-income countries is more cost-effective than the things funded by proponents of randomized controlled trials development. (1 hour - if you’re short on time, read Sections 1-3)
- Save a life or receive cash? Which do recipients want? - IDinsight - Explores the preferences and values of individuals and communities in Ghana and Kenya to inform funding allocations. (10 mins.)
Criticisms of the use of cost-effectiveness estimates #
- Evidence, cluelessness, and the long term - Evidence covers only the more immediate effects of any intervention, and it’s highly likely the vast majority of the value is thereby omitted from the calculation. (30 mins.)
- _ Charity Cost-Effectiveness in an Uncertain World – Center on Long-Term Risk_ - Another way to deal with prioritization under uncertainty is to focus on actions that seem likely to have generally positive effects across many scenarios, rather than focusing on clear, quantifiable metrics. (30 mins.)
- How not to be a “white in shining armor” - How GiveWell (as of 2012) tries to avoid “developed-world savior” interventions that don’t take into account local context (3 mins.)
- Why Charities Usually Don’t Differ Astronomically in Expected Cost-Effectiveness - An argument about how those in the effective altruism movement might overestimate the extent to which charities differ in their expected marginal cost-effectiveness. (40 mins.)
-
1 kg is the global value, and it is much smaller for many countries. Most of the countries emit less than 0.1 % of the plastic waste to the ocean (see this map), although 3 % of the global plastic waste is emitted to the ocea ↩︎
-
On average, grants from our Top Charities Fund in 2021 saved a life for about $5,000. Learn more about our estimated cost to save a life in “How We Produce Impact Estimates.” ↩︎